NFL Scores ‘Halo Effect’ For Advertisers, TVision Study Finds
Data shows context matters in generating attention


Super Bowl LX might not have been the most impressive game in what was otherwise a remarkable National Football League season, but new data show that the NFL remains a sound investment for advertisers because commercials shown in-game have a “halo” effect.
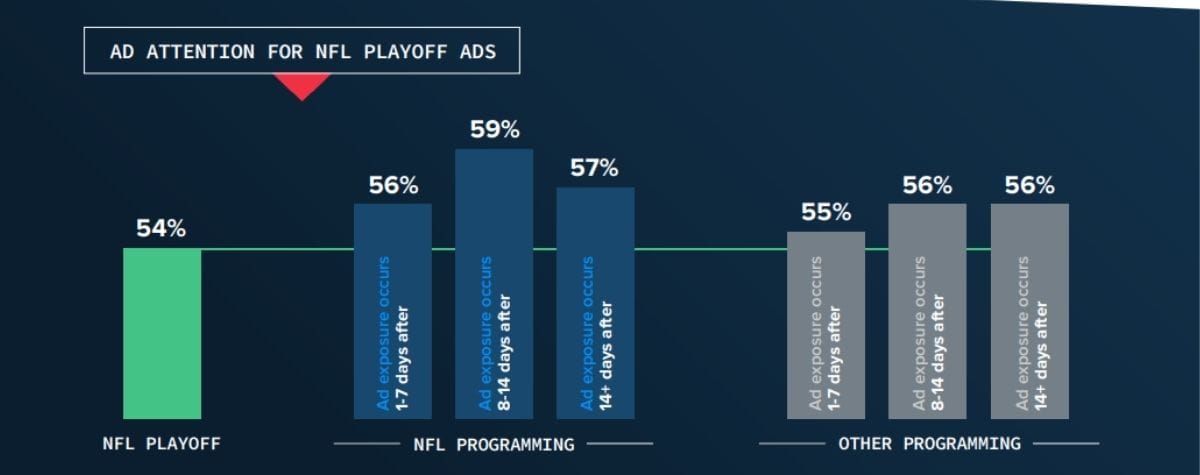
In its State of Streaming report, research company TVision found that ads that were originally viewed in an NFL playoff game capture more attention on subsequent viewings of the ad in later NFL playoff games.
TVision also found that a smaller increase in attention occurs for those same ads when viewed in non NFL TV programming.
The report also notes that not all of the networks and streaming services that carry the NFL games generate the same attention for their games.
The average attention score for NFL games was 53. The high was 59 and the low was 50. Given the cost of commercials in NFL games, this difference could be significant.
“Attention to NFL games varies across the apps and networks where the games air. The attention viewers pay to games is influenced by the on-field activity — close scores, big plays and rivalries all influence viewer attention to a particular game,” the report said. “Other factors that influence attention include the broadcast team, the schedule of programming and other things that are app/network specific.”
With all the attention being paid to contextual targeting, the TVision research found that context matters. Commercials for marketers in the same industry got different results when shown in different types of programming.
“Several factors influence an ad’s ability to capture audience attention—the creative storytelling, the audience, pod placement and the time of day an ad runs all influence attention. Another important impact on attention is context,” the report said.
In the report, a Subaru commercial performed well in reality/home improvement programming but underperformed in a crime drama.
“The relationship between brand category and programming context is not always intuitive,” TVision said. “For example, restaurant ads perform poorly in ‘romance’ but much better when the context is ‘troubled relationships.’”
In looking at TV commercials in all programming, TVision found that linear ads traditionally deliver higher overall attention and presence than CTV ads.
TVision says linear networks score higher because viewers are accustomed to having commercials interrupt their programming.
In streaming, middle-pod ads register the lowest overall attention, taking a larger dip when compared to last-in-pod ads than linear. The prevalence of ad counters on streaming TV may contribute to the drop in attention mid-pod, the report said.
Across all dayparts viewers pay more attention to premium CTV apps than YouTube, according to TVision’s Attention to Duration Ratio. (In order to account for the wide range of content lengths across YouTube’s video library, these metrics have been weighted based on the duration of the viewing session.)
In terms of household reach, the digital natives top the list with YouTube No. 1 with 69.4%, followed by Netflix with 68.6% and Amazon Prime Video with 59.2% Those were the only streamers with more than 50% reach.
FAST apps reach 37.8% of households.
Disney+ and Hulu combined to provide the Walt Disney Company significant reach to streaming households. Hulu reached 36.2% of households and Disney+ 28.2%.
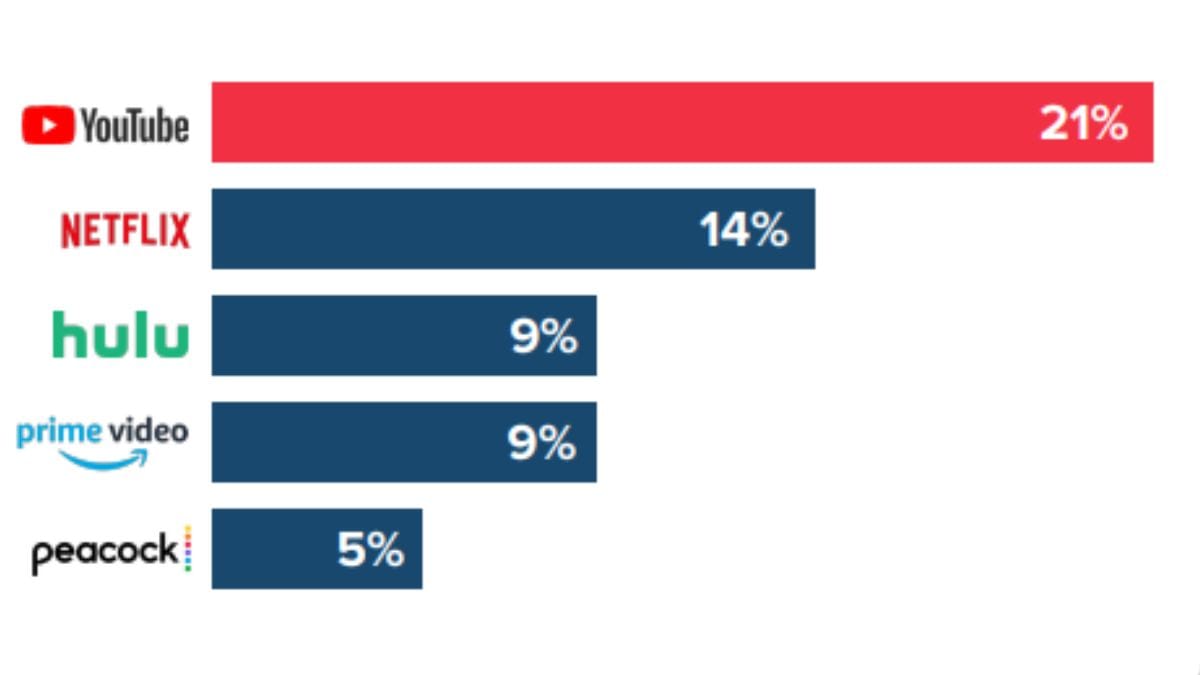
Looking at share of time spent viewing, five apps captured more than half of all viewing time in the second half of 2025. YouTube was the leader with 21%, followed by Netflix (14%), Hulu (9%), Prime Video (9%) and Peacock (5%).
Looking at programming, Netflix content dominated the second half of 2025 with the app seeing 11 shows and 11 movies make the top 20 for the month.
The top overall program was Netflix’s Wednesday. Netflix’s KPop Demon Hunters was the top movie based on TVision’s Power Score metrics.
# # #
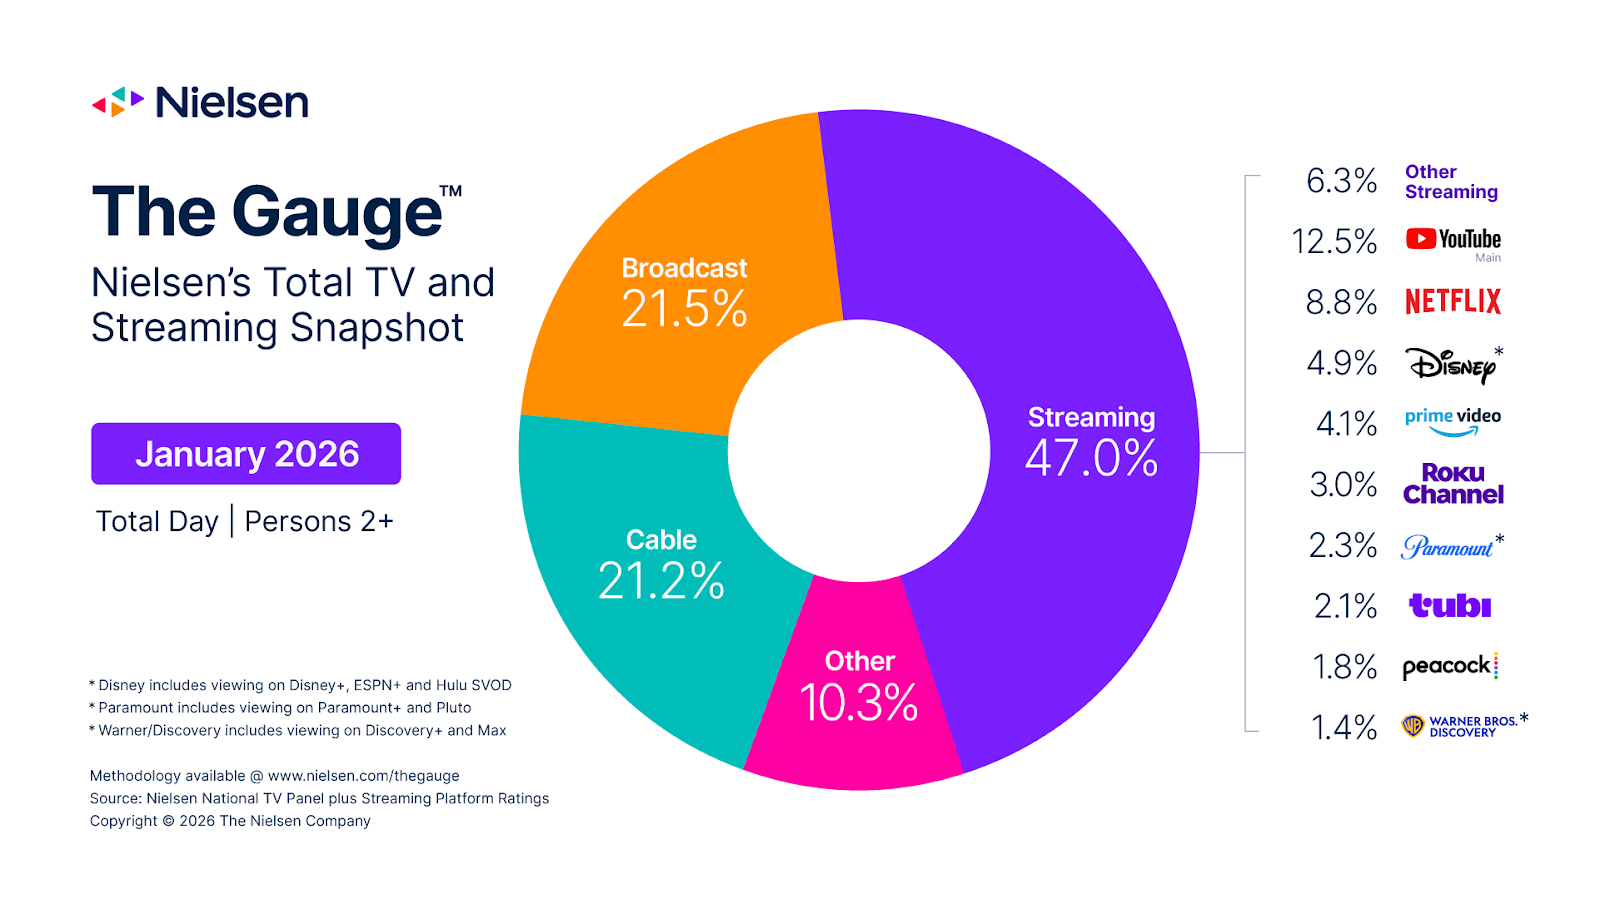
Television viewing hit a 12-month high in January, with football and dramas scoring as wintry weather kept audiences indoors, according to Nielsen’s monthly report.
Viewing rose 3.7%, with cable showing a 9% gain, increasing its share to 21.2% from 20.2% in December. Sports viewing was up 49% on cable led by ESPN’s coverage of the College Football Playoffs. Cable also benefited from a busy news cycle.
Broadcast had a 21.5% share of viewing, with NFL games representing the top 15 programs. Dramas on broadcast networks were up 24%, with ABC’s High Potential the most-watched show.
Time spent streaming was up 2.7% and the streamers had a 47% share of total viewing, led again by YouTube.
Peacock viewership was up 10% boosted by series including The Traitors and simulcasts of NBC’s NFL games. Peacock viewing went up 78% during the Bears-Rams playoff game.
Netflix had the top streaming program with Stranger Things, which generated 15.4 billion viewing minutes in January.